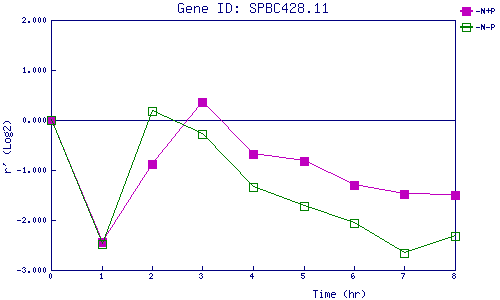
| 0 | 1 | 2 | 3 | 4 | 5 | 6 | 7 | 8 | |
| -N+P | 0.000 | -2.446 | -0.878 | 0.362 | -0.684 | -0.827 | -1.301 | -1.471 | -1.496 |
| -N-P | 0.000 | -2.471 | 0.174 | -0.270 | -1.335 | -1.731 | -2.051 | -2.653 | -2.325 |
|
-N+P: Nitrogen starved in the presence of P-factor -N-P: Nitrogen starved in the absence of P-factor |