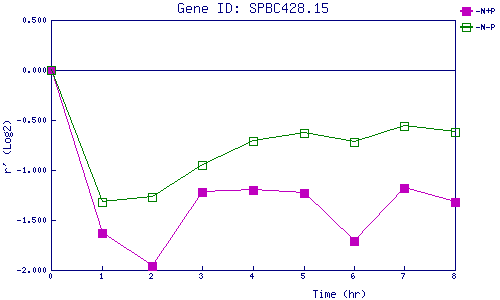
| 0 | 1 | 2 | 3 | 4 | 5 | 6 | 7 | 8 | |
| -N+P | 0.000 | -1.629 | -1.961 | -1.225 | -1.198 | -1.233 | -1.711 | -1.178 | -1.321 |
| -N-P | 0.000 | -1.321 | -1.271 | -0.949 | -0.713 | -0.629 | -0.717 | -0.561 | -0.622 |
|
-N+P: Nitrogen starved in the presence of P-factor -N-P: Nitrogen starved in the absence of P-factor |