cdt1
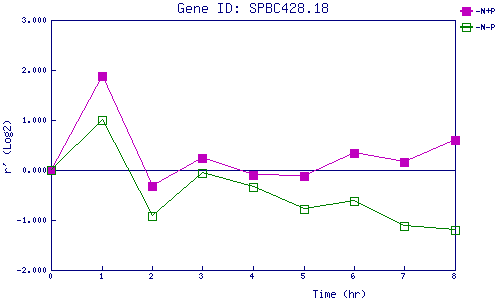
| 0 | 1 | 2 | 3 | 4 | 5 | 6 | 7 | 8 | |
| -N+P | 0.000 | 1.871 | -0.327 | 0.232 | -0.093 | -0.124 | 0.332 | 0.155 | 0.596 |
| -N-P | 0.000 | 0.993 | -0.930 | -0.067 | -0.342 | -0.776 | -0.613 | -1.123 | -1.192 |
|
-N+P: Nitrogen starved in the presence of P-factor -N-P: Nitrogen starved in the absence of P-factor |