| 0 | 1 | 2 | 3 | 4 | 5 | 6 | 7 | 8 | |
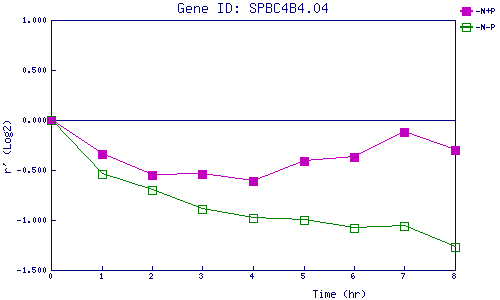
| -N+P | 0.000 | -0.342 | -0.549 | -0.538 | -0.606 | -0.408 | -0.374 | -0.118 | -0.300 |
| -N-P | 0.000 | -0.541 | -0.704 | -0.893 | -0.983 | -1.004 | -1.080 | -1.058 | -1.266 |
|
-N+P: Nitrogen starved in the presence of P-factor -N-P: Nitrogen starved in the absence of P-factor |