smg1
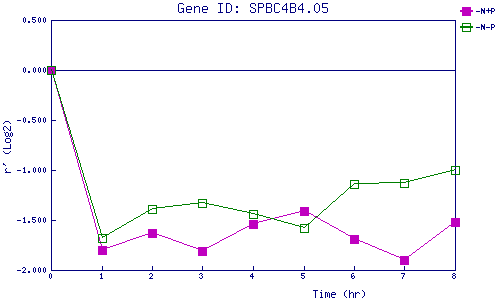
| 0 | 1 | 2 | 3 | 4 | 5 | 6 | 7 | 8 | |
| -N+P | 0.000 | -1.798 | -1.628 | -1.808 | -1.545 | -1.407 | -1.687 | -1.899 | -1.518 |
| -N-P | 0.000 | -1.682 | -1.390 | -1.333 | -1.444 | -1.585 | -1.140 | -1.133 | -1.000 |
|
-N+P: Nitrogen starved in the presence of P-factor -N-P: Nitrogen starved in the absence of P-factor |