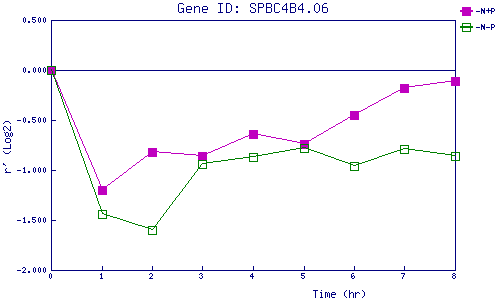
| 0 | 1 | 2 | 3 | 4 | 5 | 6 | 7 | 8 | |
| -N+P | 0.000 | -1.203 | -0.823 | -0.861 | -0.635 | -0.743 | -0.451 | -0.175 | -0.112 |
| -N-P | 0.000 | -1.440 | -1.599 | -0.942 | -0.866 | -0.777 | -0.964 | -0.787 | -0.864 |
|
-N+P: Nitrogen starved in the presence of P-factor -N-P: Nitrogen starved in the absence of P-factor |