| 0 | 1 | 2 | 3 | 4 | 5 | 6 | 7 | 8 | |
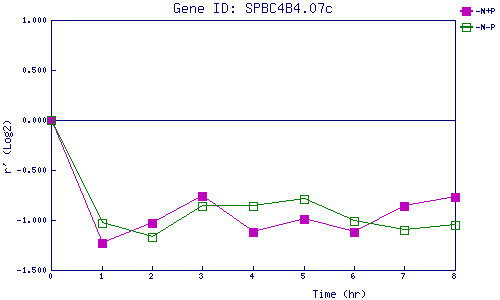
| -N+P | 0.000 | -1.230 | -1.034 | -0.765 | -1.119 | -0.991 | -1.121 | -0.856 | -0.766 |
| -N-P | 0.000 | -1.034 | -1.170 | -0.863 | -0.856 | -0.792 | -1.014 | -1.099 | -1.047 |
|
-N+P: Nitrogen starved in the presence of P-factor -N-P: Nitrogen starved in the absence of P-factor |