ght2
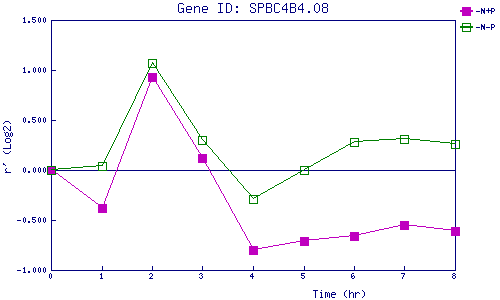
| 0 | 1 | 2 | 3 | 4 | 5 | 6 | 7 | 8 | |
| -N+P | 0.000 | -0.385 | 0.933 | 0.119 | -0.796 | -0.706 | -0.662 | -0.552 | -0.614 |
| -N-P | 0.000 | 0.045 | 1.072 | 0.305 | -0.293 | -0.003 | 0.283 | 0.309 | 0.263 |
|
-N+P: Nitrogen starved in the presence of P-factor -N-P: Nitrogen starved in the absence of P-factor |