prp39
| 0 | 1 | 2 | 3 | 4 | 5 | 6 | 7 | 8 | |
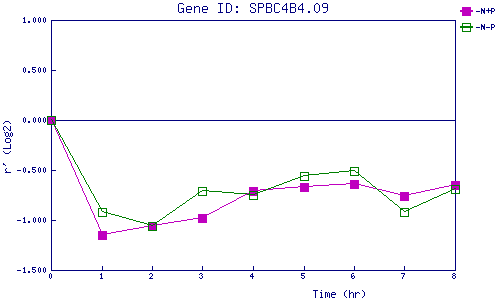
| -N+P | 0.000 | -1.148 | -1.057 | -0.979 | -0.711 | -0.672 | -0.641 | -0.760 | -0.648 |
| -N-P | 0.000 | -0.918 | -1.056 | -0.711 | -0.754 | -0.564 | -0.514 | -0.920 | -0.691 |
|
-N+P: Nitrogen starved in the presence of P-factor -N-P: Nitrogen starved in the absence of P-factor |