| 0 | 1 | 2 | 3 | 4 | 5 | 6 | 7 | 8 | |
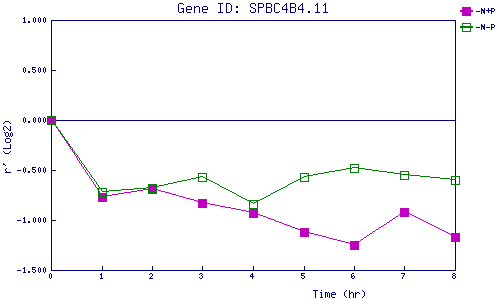
| -N+P | 0.000 | -0.769 | -0.687 | -0.832 | -0.928 | -1.122 | -1.253 | -0.924 | -1.170 |
| -N-P | 0.000 | -0.724 | -0.678 | -0.567 | -0.835 | -0.572 | -0.485 | -0.551 | -0.596 |
|
-N+P: Nitrogen starved in the presence of P-factor -N-P: Nitrogen starved in the absence of P-factor |