ade1 min4
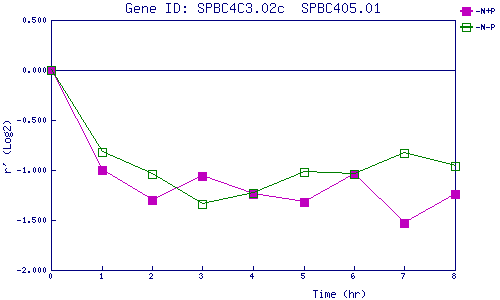
| 0 | 1 | 2 | 3 | 4 | 5 | 6 | 7 | 8 | |
| -N+P | 0.000 | -1.002 | -1.296 | -1.055 | -1.244 | -1.321 | -1.035 | -1.530 | -1.244 |
| -N-P | 0.000 | -0.816 | -1.043 | -1.342 | -1.228 | -1.025 | -1.036 | -0.834 | -0.964 |
|
-N+P: Nitrogen starved in the presence of P-factor -N-P: Nitrogen starved in the absence of P-factor |