nuc1
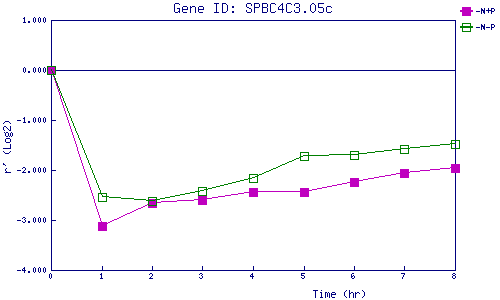
| 0 | 1 | 2 | 3 | 4 | 5 | 6 | 7 | 8 | |
| -N+P | 0.000 | -3.120 | -2.664 | -2.606 | -2.443 | -2.445 | -2.242 | -2.054 | -1.955 |
| -N-P | 0.000 | -2.539 | -2.625 | -2.422 | -2.150 | -1.711 | -1.697 | -1.588 | -1.487 |
|
-N+P: Nitrogen starved in the presence of P-factor -N-P: Nitrogen starved in the absence of P-factor |