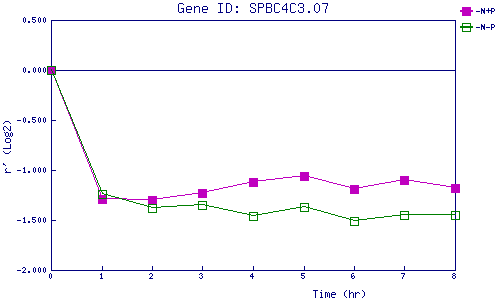
| 0 | 1 | 2 | 3 | 4 | 5 | 6 | 7 | 8 | |
| -N+P | 0.000 | -1.288 | -1.305 | -1.228 | -1.122 | -1.065 | -1.190 | -1.096 | -1.181 |
| -N-P | 0.000 | -1.237 | -1.385 | -1.347 | -1.460 | -1.372 | -1.508 | -1.452 | -1.447 |
|
-N+P: Nitrogen starved in the presence of P-factor -N-P: Nitrogen starved in the absence of P-factor |