smf1
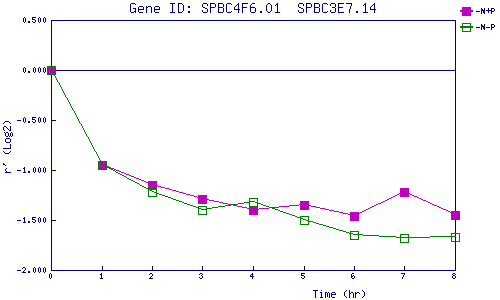
| 0 | 1 | 2 | 3 | 4 | 5 | 6 | 7 | 8 | |
| -N+P | 0.000 | -0.953 | -1.151 | -1.287 | -1.403 | -1.351 | -1.459 | -1.222 | -1.452 |
| -N-P | 0.000 | -0.952 | -1.224 | -1.396 | -1.324 | -1.500 | -1.650 | -1.681 | -1.667 |
|
-N+P: Nitrogen starved in the presence of P-factor -N-P: Nitrogen starved in the absence of P-factor |