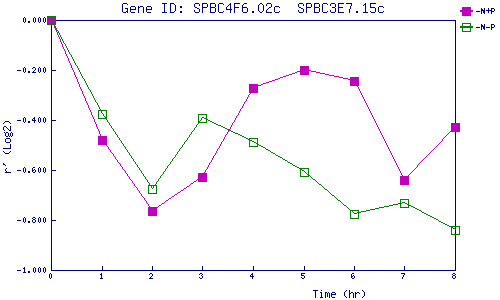
| 0 | 1 | 2 | 3 | 4 | 5 | 6 | 7 | 8 | |
| -N+P | 0.000 | -0.478 | -0.763 | -0.629 | -0.272 | -0.199 | -0.243 | -0.638 | -0.428 |
| -N-P | 0.000 | -0.376 | -0.676 | -0.391 | -0.486 | -0.609 | -0.777 | -0.731 | -0.842 |
|
-N+P: Nitrogen starved in the presence of P-factor -N-P: Nitrogen starved in the absence of P-factor |