rpl23a-2 rpl25b rpl2502
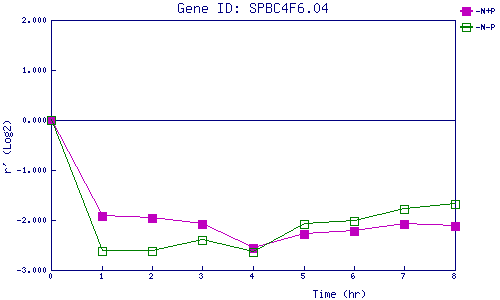
| 0 | 1 | 2 | 3 | 4 | 5 | 6 | 7 | 8 | |
| -N+P | 0.000 | -1.929 | -1.955 | -2.077 | -2.565 | -2.281 | -2.227 | -2.081 | -2.127 |
| -N-P | 0.000 | -2.626 | -2.612 | -2.393 | -2.648 | -2.070 | -2.017 | -1.773 | -1.679 |
|
-N+P: Nitrogen starved in the presence of P-factor -N-P: Nitrogen starved in the absence of P-factor |