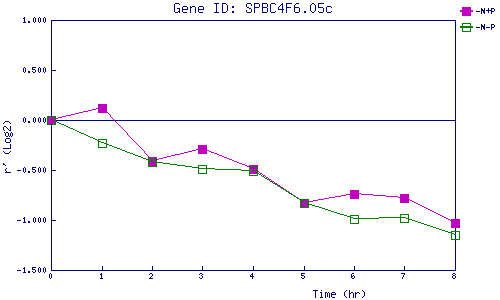
| 0 | 1 | 2 | 3 | 4 | 5 | 6 | 7 | 8 | |
| -N+P | 0.000 | 0.121 | -0.408 | -0.292 | -0.490 | -0.832 | -0.735 | -0.780 | -1.031 |
| -N-P | 0.000 | -0.227 | -0.418 | -0.493 | -0.514 | -0.831 | -0.989 | -0.983 | -1.153 |
|
-N+P: Nitrogen starved in the presence of P-factor -N-P: Nitrogen starved in the absence of P-factor |