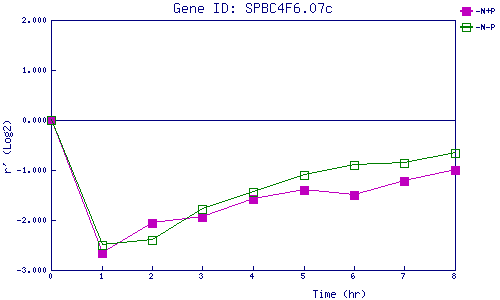
| 0 | 1 | 2 | 3 | 4 | 5 | 6 | 7 | 8 | |
| -N+P | 0.000 | -2.656 | -2.062 | -1.931 | -1.583 | -1.402 | -1.509 | -1.222 | -1.011 |
| -N-P | 0.000 | -2.498 | -2.407 | -1.774 | -1.443 | -1.095 | -0.902 | -0.852 | -0.667 |
|
-N+P: Nitrogen starved in the presence of P-factor -N-P: Nitrogen starved in the absence of P-factor |