| 0 | 1 | 2 | 3 | 4 | 5 | 6 | 7 | 8 | |
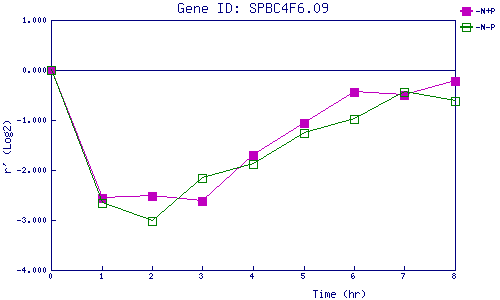
| -N+P | 0.000 | -2.564 | -2.530 | -2.622 | -1.692 | -1.055 | -0.449 | -0.495 | -0.229 |
| -N-P | 0.000 | -2.653 | -3.022 | -2.151 | -1.889 | -1.262 | -0.980 | -0.447 | -0.623 |
|
-N+P: Nitrogen starved in the presence of P-factor -N-P: Nitrogen starved in the absence of P-factor |
