vps901 vps9a
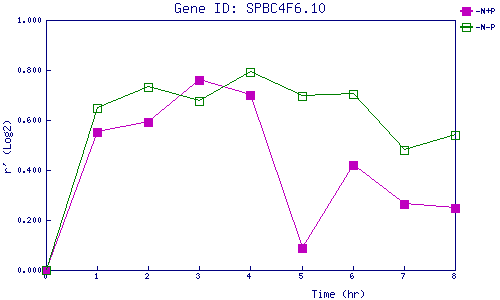
| 0 | 1 | 2 | 3 | 4 | 5 | 6 | 7 | 8 | |
| -N+P | 0.000 | 0.551 | 0.593 | 0.761 | 0.701 | 0.088 | 0.421 | 0.262 | 0.250 |
| -N-P | 0.000 | 0.646 | 0.733 | 0.677 | 0.794 | 0.698 | 0.706 | 0.478 | 0.540 |
|
-N+P: Nitrogen starved in the presence of P-factor -N-P: Nitrogen starved in the absence of P-factor |