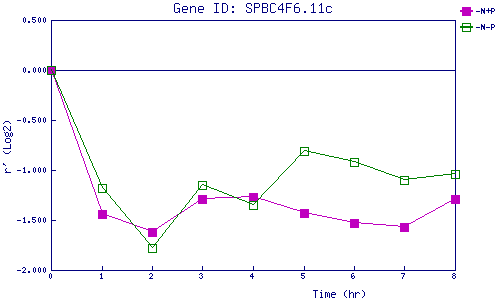
| 0 | 1 | 2 | 3 | 4 | 5 | 6 | 7 | 8 | |
| -N+P | 0.000 | -1.436 | -1.616 | -1.290 | -1.271 | -1.431 | -1.533 | -1.569 | -1.294 |
| -N-P | 0.000 | -1.184 | -1.778 | -1.148 | -1.351 | -0.809 | -0.920 | -1.097 | -1.042 |
|
-N+P: Nitrogen starved in the presence of P-factor -N-P: Nitrogen starved in the absence of P-factor |