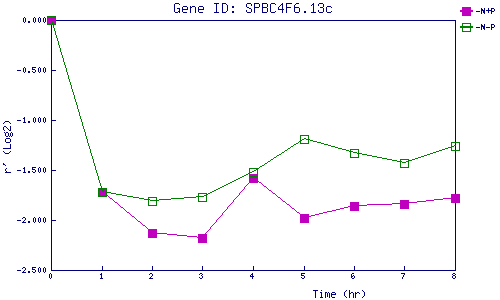
| 0 | 1 | 2 | 3 | 4 | 5 | 6 | 7 | 8 | |
| -N+P | 0.000 | -1.725 | -2.127 | -2.180 | -1.577 | -1.982 | -1.865 | -1.840 | -1.780 |
| -N-P | 0.000 | -1.720 | -1.810 | -1.766 | -1.517 | -1.189 | -1.334 | -1.434 | -1.264 |
|
-N+P: Nitrogen starved in the presence of P-factor -N-P: Nitrogen starved in the absence of P-factor |