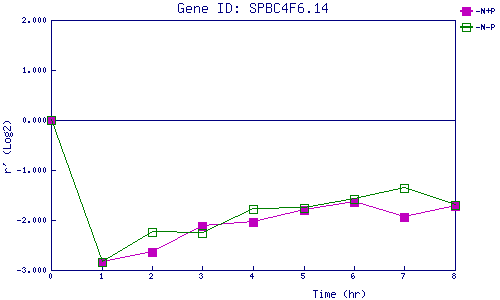
| 0 | 1 | 2 | 3 | 4 | 5 | 6 | 7 | 8 | |
| -N+P | 0.000 | -2.833 | -2.639 | -2.125 | -2.043 | -1.805 | -1.646 | -1.945 | -1.717 |
| -N-P | 0.000 | -2.838 | -2.250 | -2.264 | -1.778 | -1.750 | -1.581 | -1.354 | -1.697 |
|
-N+P: Nitrogen starved in the presence of P-factor -N-P: Nitrogen starved in the absence of P-factor |