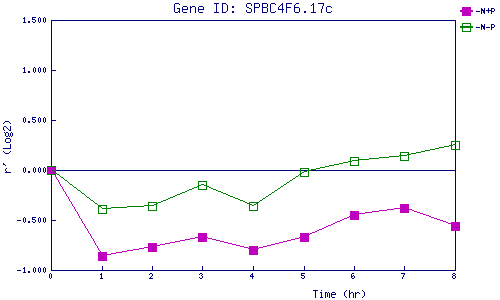
| 0 | 1 | 2 | 3 | 4 | 5 | 6 | 7 | 8 | |
| -N+P | 0.000 | -0.855 | -0.767 | -0.671 | -0.800 | -0.668 | -0.448 | -0.381 | -0.561 |
| -N-P | 0.000 | -0.386 | -0.355 | -0.149 | -0.362 | -0.023 | 0.089 | 0.138 | 0.251 |
|
-N+P: Nitrogen starved in the presence of P-factor -N-P: Nitrogen starved in the absence of P-factor |
