arf1
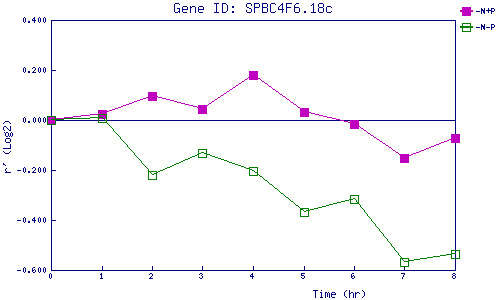
| 0 | 1 | 2 | 3 | 4 | 5 | 6 | 7 | 8 | |
| -N+P | 0.000 | 0.022 | 0.096 | 0.045 | 0.180 | 0.032 | -0.015 | -0.150 | -0.074 |
| -N-P | 0.000 | 0.006 | -0.220 | -0.133 | -0.204 | -0.367 | -0.315 | -0.566 | -0.538 |
|
-N+P: Nitrogen starved in the presence of P-factor -N-P: Nitrogen starved in the absence of P-factor |