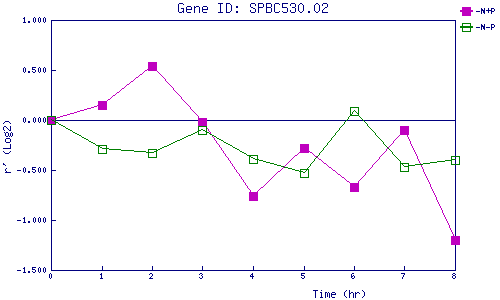
| 0 | 1 | 2 | 3 | 4 | 5 | 6 | 7 | 8 | |
| -N+P | 0.000 | 0.151 | 0.544 | -0.017 | -0.755 | -0.282 | -0.668 | -0.104 | -1.202 |
| -N-P | 0.000 | -0.287 | -0.331 | -0.103 | -0.393 | -0.530 | 0.088 | -0.474 | -0.396 |
|
-N+P: Nitrogen starved in the presence of P-factor -N-P: Nitrogen starved in the absence of P-factor |