bag102 bag1-b
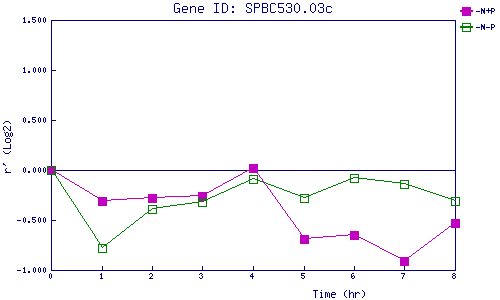
| 0 | 1 | 2 | 3 | 4 | 5 | 6 | 7 | 8 | |
| -N+P | 0.000 | -0.312 | -0.275 | -0.265 | 0.025 | -0.689 | -0.651 | -0.913 | -0.532 |
| -N-P | 0.000 | -0.781 | -0.391 | -0.324 | -0.091 | -0.282 | -0.080 | -0.145 | -0.309 |
|
-N+P: Nitrogen starved in the presence of P-factor -N-P: Nitrogen starved in the absence of P-factor |