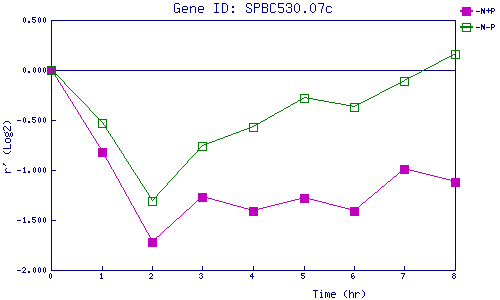
| 0 | 1 | 2 | 3 | 4 | 5 | 6 | 7 | 8 | |
| -N+P | 0.000 | -0.825 | -1.718 | -1.273 | -1.412 | -1.280 | -1.408 | -0.993 | -1.124 |
| -N-P | 0.000 | -0.533 | -1.313 | -0.759 | -0.567 | -0.284 | -0.373 | -0.113 | 0.155 |
|
-N+P: Nitrogen starved in the presence of P-factor -N-P: Nitrogen starved in the absence of P-factor |