reserved_name_yhc1
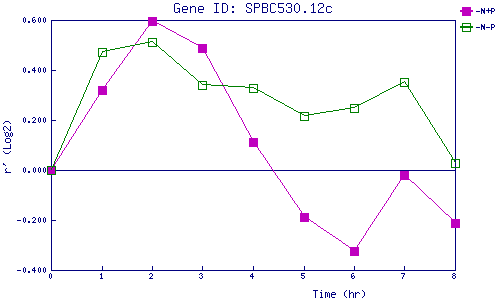
| 0 | 1 | 2 | 3 | 4 | 5 | 6 | 7 | 8 | |
| -N+P | 0.000 | 0.319 | 0.597 | 0.487 | 0.110 | -0.187 | -0.325 | -0.020 | -0.212 |
| -N-P | 0.000 | 0.472 | 0.514 | 0.340 | 0.328 | 0.217 | 0.246 | 0.350 | 0.027 |
|
-N+P: Nitrogen starved in the presence of P-factor -N-P: Nitrogen starved in the absence of P-factor |