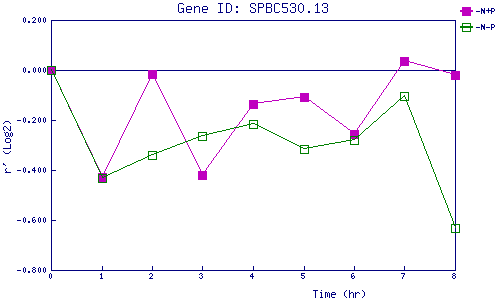
| 0 | 1 | 2 | 3 | 4 | 5 | 6 | 7 | 8 | |
| -N+P | 0.000 | -0.427 | -0.017 | -0.421 | -0.135 | -0.108 | -0.256 | 0.037 | -0.019 |
| -N-P | 0.000 | -0.434 | -0.340 | -0.262 | -0.218 | -0.317 | -0.278 | -0.103 | -0.633 |
|
-N+P: Nitrogen starved in the presence of P-factor -N-P: Nitrogen starved in the absence of P-factor |