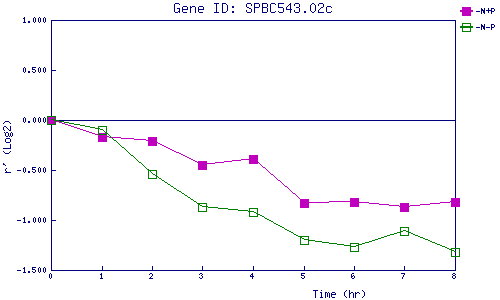
| 0 | 1 | 2 | 3 | 4 | 5 | 6 | 7 | 8 | |
| -N+P | 0.000 | -0.170 | -0.214 | -0.453 | -0.390 | -0.830 | -0.819 | -0.873 | -0.815 |
| -N-P | 0.000 | -0.099 | -0.537 | -0.873 | -0.919 | -1.204 | -1.267 | -1.111 | -1.317 |
|
-N+P: Nitrogen starved in the presence of P-factor -N-P: Nitrogen starved in the absence of P-factor |