| 0 | 1 | 2 | 3 | 4 | 5 | 6 | 7 | 8 | |
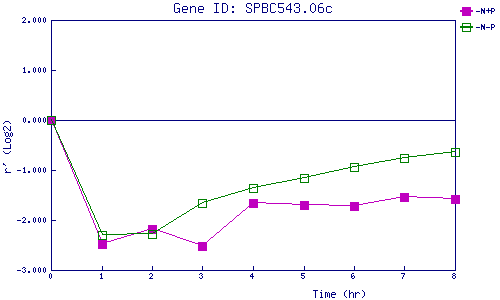
| -N+P | 0.000 | -2.483 | -2.176 | -2.527 | -1.664 | -1.700 | -1.729 | -1.544 | -1.576 |
| -N-P | 0.000 | -2.305 | -2.284 | -1.651 | -1.360 | -1.170 | -0.942 | -0.754 | -0.645 |
|
-N+P: Nitrogen starved in the presence of P-factor -N-P: Nitrogen starved in the absence of P-factor |