skh1 pek1 mkk1
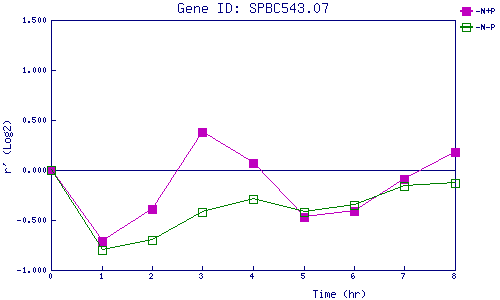
| 0 | 1 | 2 | 3 | 4 | 5 | 6 | 7 | 8 | |
| -N+P | 0.000 | -0.707 | -0.393 | 0.385 | 0.068 | -0.467 | -0.410 | -0.091 | 0.184 |
| -N-P | 0.000 | -0.804 | -0.700 | -0.424 | -0.287 | -0.417 | -0.346 | -0.155 | -0.132 |
|
-N+P: Nitrogen starved in the presence of P-factor -N-P: Nitrogen starved in the absence of P-factor |