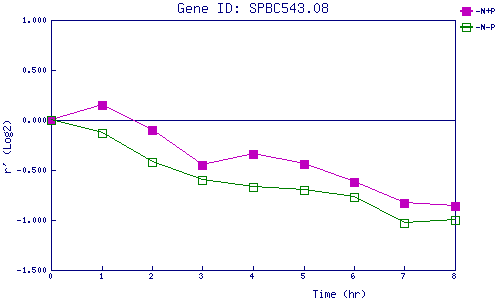
| 0 | 1 | 2 | 3 | 4 | 5 | 6 | 7 | 8 | |
| -N+P | 0.000 | 0.151 | -0.101 | -0.451 | -0.336 | -0.443 | -0.617 | -0.828 | -0.862 |
| -N-P | 0.000 | -0.134 | -0.423 | -0.600 | -0.672 | -0.699 | -0.768 | -1.030 | -0.997 |
|
-N+P: Nitrogen starved in the presence of P-factor -N-P: Nitrogen starved in the absence of P-factor |