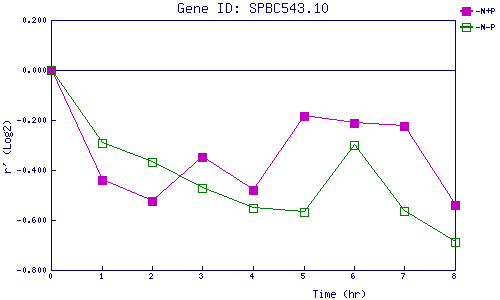
| 0 | 1 | 2 | 3 | 4 | 5 | 6 | 7 | 8 | |
| -N+P | 0.000 | -0.442 | -0.524 | -0.349 | -0.481 | -0.183 | -0.211 | -0.225 | -0.539 |
| -N-P | 0.000 | -0.292 | -0.368 | -0.473 | -0.551 | -0.567 | -0.301 | -0.564 | -0.690 |
|
-N+P: Nitrogen starved in the presence of P-factor -N-P: Nitrogen starved in the absence of P-factor |