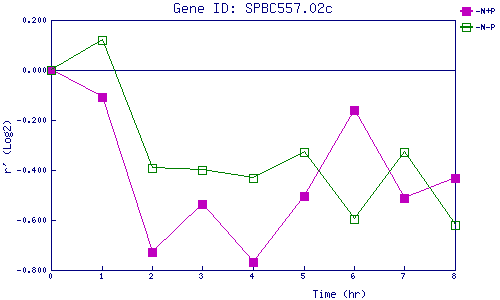
| 0 | 1 | 2 | 3 | 4 | 5 | 6 | 7 | 8 | |
| -N+P | 0.000 | -0.109 | -0.728 | -0.536 | -0.769 | -0.504 | -0.161 | -0.511 | -0.430 |
| -N-P | 0.000 | 0.121 | -0.391 | -0.399 | -0.433 | -0.329 | -0.595 | -0.329 | -0.621 |
|
-N+P: Nitrogen starved in the presence of P-factor -N-P: Nitrogen starved in the absence of P-factor |