pim1 dcd1 ptr2
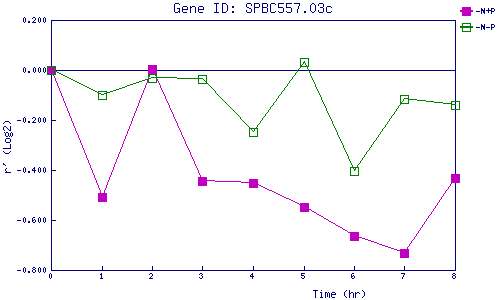
| 0 | 1 | 2 | 3 | 4 | 5 | 6 | 7 | 8 | |
| -N+P | 0.000 | -0.508 | 0.004 | -0.443 | -0.451 | -0.549 | -0.666 | -0.732 | -0.431 |
| -N-P | 0.000 | -0.099 | -0.031 | -0.036 | -0.250 | 0.032 | -0.403 | -0.115 | -0.140 |
|
-N+P: Nitrogen starved in the presence of P-factor -N-P: Nitrogen starved in the absence of P-factor |