rpl19-1 rpl1901
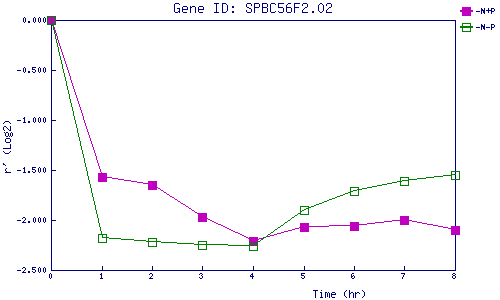
| 0 | 1 | 2 | 3 | 4 | 5 | 6 | 7 | 8 | |
| -N+P | 0.000 | -1.567 | -1.648 | -1.970 | -2.211 | -2.069 | -2.059 | -2.002 | -2.096 |
| -N-P | 0.000 | -2.176 | -2.216 | -2.249 | -2.263 | -1.903 | -1.711 | -1.609 | -1.552 |
|
-N+P: Nitrogen starved in the presence of P-factor -N-P: Nitrogen starved in the absence of P-factor |