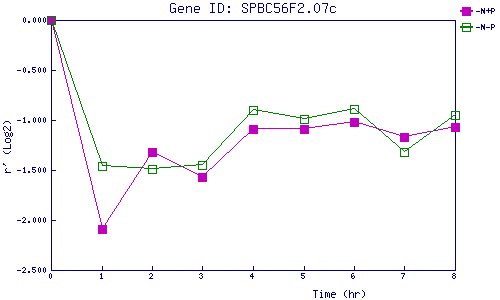
| 0 | 1 | 2 | 3 | 4 | 5 | 6 | 7 | 8 | |
| -N+P | 0.000 | -2.090 | -1.325 | -1.574 | -1.087 | -1.091 | -1.021 | -1.174 | -1.070 |
| -N-P | 0.000 | -1.459 | -1.487 | -1.451 | -0.895 | -0.992 | -0.893 | -1.315 | -0.954 |
|
-N+P: Nitrogen starved in the presence of P-factor -N-P: Nitrogen starved in the absence of P-factor |