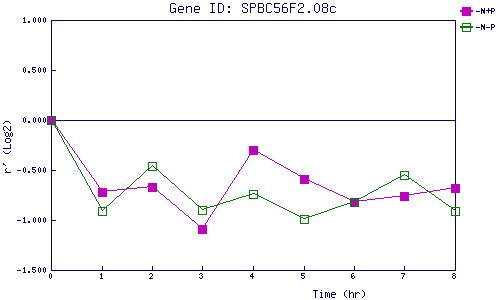
| 0 | 1 | 2 | 3 | 4 | 5 | 6 | 7 | 8 | |
| -N+P | 0.000 | -0.718 | -0.672 | -1.087 | -0.302 | -0.590 | -0.820 | -0.755 | -0.677 |
| -N-P | 0.000 | -0.907 | -0.456 | -0.900 | -0.744 | -0.994 | -0.817 | -0.552 | -0.909 |
|
-N+P: Nitrogen starved in the presence of P-factor -N-P: Nitrogen starved in the absence of P-factor |