| 0 | 1 | 2 | 3 | 4 | 5 | 6 | 7 | 8 | |
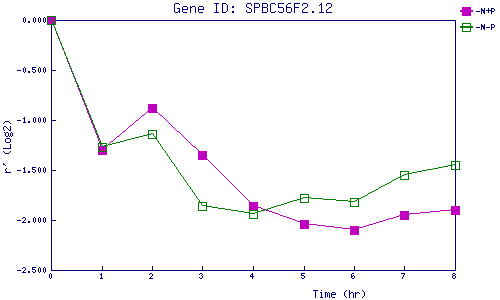
| -N+P | 0.000 | -1.297 | -0.880 | -1.346 | -1.860 | -2.045 | -2.095 | -1.948 | -1.901 |
| -N-P | 0.000 | -1.273 | -1.140 | -1.859 | -1.942 | -1.782 | -1.816 | -1.546 | -1.451 |
|
-N+P: Nitrogen starved in the presence of P-factor -N-P: Nitrogen starved in the absence of P-factor |