rpl38-1 rpl3801
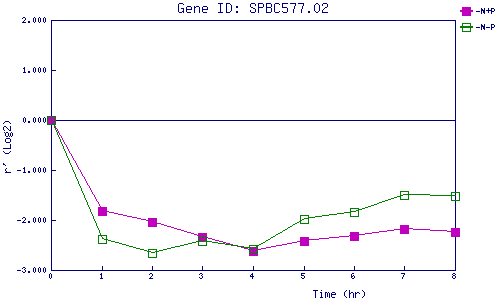
| 0 | 1 | 2 | 3 | 4 | 5 | 6 | 7 | 8 | |
| -N+P | 0.000 | -1.813 | -2.036 | -2.331 | -2.615 | -2.421 | -2.311 | -2.179 | -2.243 |
| -N-P | 0.000 | -2.380 | -2.659 | -2.418 | -2.575 | -1.984 | -1.836 | -1.509 | -1.524 |
|
-N+P: Nitrogen starved in the presence of P-factor -N-P: Nitrogen starved in the absence of P-factor |