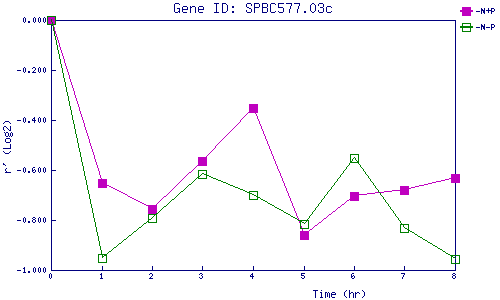
| 0 | 1 | 2 | 3 | 4 | 5 | 6 | 7 | 8 | |
| -N+P | 0.000 | -0.651 | -0.757 | -0.565 | -0.354 | -0.859 | -0.705 | -0.682 | -0.634 |
| -N-P | 0.000 | -0.951 | -0.791 | -0.618 | -0.701 | -0.814 | -0.552 | -0.832 | -0.955 |
|
-N+P: Nitrogen starved in the presence of P-factor -N-P: Nitrogen starved in the absence of P-factor |