reserved_name_ubp10
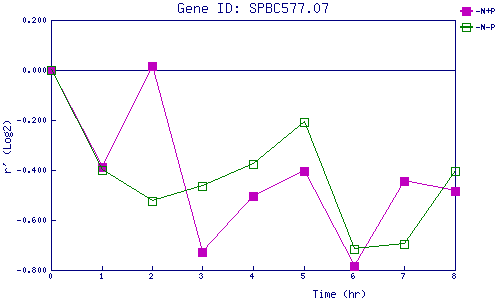
| 0 | 1 | 2 | 3 | 4 | 5 | 6 | 7 | 8 | |
| -N+P | 0.000 | -0.389 | 0.016 | -0.727 | -0.504 | -0.405 | -0.784 | -0.444 | -0.484 |
| -N-P | 0.000 | -0.398 | -0.524 | -0.465 | -0.376 | -0.206 | -0.717 | -0.695 | -0.404 |
|
-N+P: Nitrogen starved in the presence of P-factor -N-P: Nitrogen starved in the absence of P-factor |