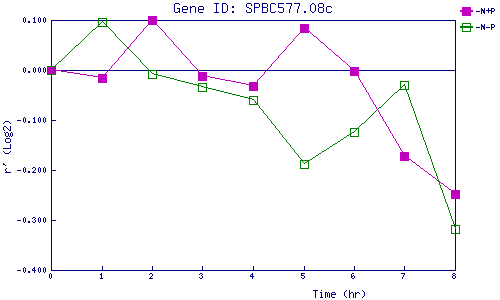
| 0 | 1 | 2 | 3 | 4 | 5 | 6 | 7 | 8 | |
| -N+P | 0.000 | -0.015 | 0.100 | -0.012 | -0.033 | 0.083 | -0.002 | -0.172 | -0.248 |
| -N-P | 0.000 | 0.095 | -0.009 | -0.034 | -0.060 | -0.189 | -0.125 | -0.030 | -0.318 |
|
-N+P: Nitrogen starved in the presence of P-factor -N-P: Nitrogen starved in the absence of P-factor |