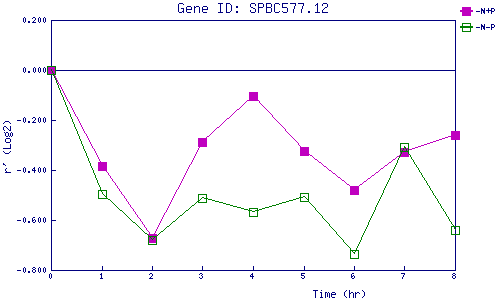
| 0 | 1 | 2 | 3 | 4 | 5 | 6 | 7 | 8 | |
| -N+P | 0.000 | -0.384 | -0.670 | -0.286 | -0.106 | -0.323 | -0.481 | -0.328 | -0.259 |
| -N-P | 0.000 | -0.494 | -0.678 | -0.514 | -0.569 | -0.508 | -0.735 | -0.308 | -0.638 |
|
-N+P: Nitrogen starved in the presence of P-factor -N-P: Nitrogen starved in the absence of P-factor |