| 0 | 1 | 2 | 3 | 4 | 5 | 6 | 7 | 8 | |
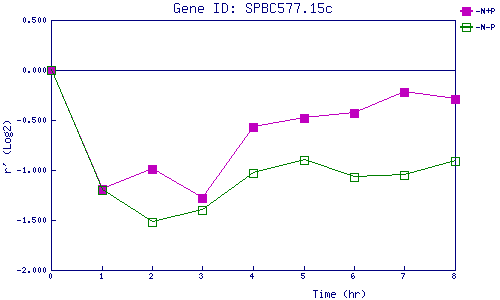
| -N+P | 0.000 | -1.191 | -0.988 | -1.280 | -0.568 | -0.485 | -0.426 | -0.220 | -0.289 |
| -N-P | 0.000 | -1.198 | -1.525 | -1.402 | -1.026 | -0.898 | -1.066 | -1.054 | -0.911 |
|
-N+P: Nitrogen starved in the presence of P-factor -N-P: Nitrogen starved in the absence of P-factor |