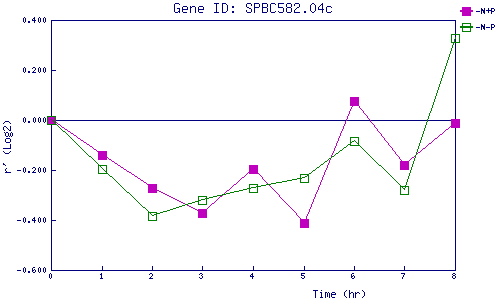
| 0 | 1 | 2 | 3 | 4 | 5 | 6 | 7 | 8 | |
| -N+P | 0.000 | -0.139 | -0.273 | -0.372 | -0.196 | -0.412 | 0.075 | -0.179 | -0.012 |
| -N-P | 0.000 | -0.196 | -0.385 | -0.318 | -0.270 | -0.231 | -0.083 | -0.280 | 0.327 |
|
-N+P: Nitrogen starved in the presence of P-factor -N-P: Nitrogen starved in the absence of P-factor |