brc1
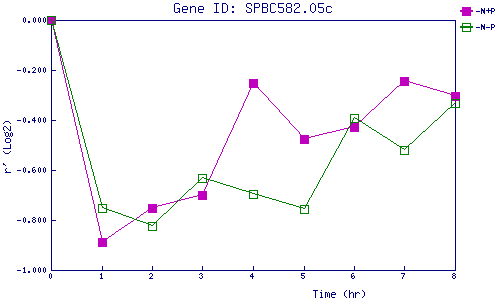
| 0 | 1 | 2 | 3 | 4 | 5 | 6 | 7 | 8 | |
| -N+P | 0.000 | -0.887 | -0.751 | -0.700 | -0.251 | -0.477 | -0.428 | -0.243 | -0.303 |
| -N-P | 0.000 | -0.754 | -0.825 | -0.631 | -0.694 | -0.755 | -0.393 | -0.521 | -0.332 |
|
-N+P: Nitrogen starved in the presence of P-factor -N-P: Nitrogen starved in the absence of P-factor |