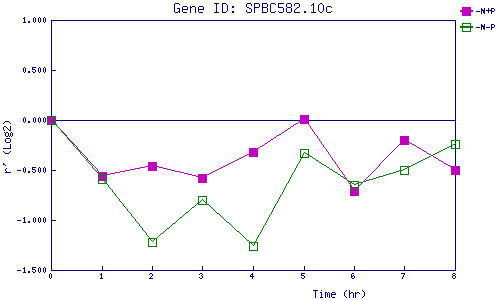
| 0 | 1 | 2 | 3 | 4 | 5 | 6 | 7 | 8 | |
| -N+P | 0.000 | -0.564 | -0.456 | -0.580 | -0.323 | 0.006 | -0.709 | -0.196 | -0.496 |
| -N-P | 0.000 | -0.592 | -1.222 | -0.800 | -1.260 | -0.327 | -0.648 | -0.498 | -0.244 |
|
-N+P: Nitrogen starved in the presence of P-factor -N-P: Nitrogen starved in the absence of P-factor |